

By Thomas, Lead Tech, over 20 years of plumbing experience.
Last updated
Which areas have the hardest and softest water?
Most of San Diego County is very hard. The City of San Diego's three treatment plants average 237 to 243 mg/L (13.8 to 14.2 grains per gallon), Helix Water District, serving La Mesa and El Cajon, averages 206 mg/L (12.0 gpg), and Vallecitos, serving San Marcos, runs 242 to 255 mg/L.
The single hardest figure in the table is Lakeside Water District's own wells, at 472 mg/L (about 27.6 gpg), though most Lakeside homes get Helix-treated water instead. In the Temecula Valley, Rancho California Water District's imported water averages 230 mg/L and its wells 151 mg/L, so taps there get a blend of very hard and hard water.
In the Inland Empire most systems report hard water, by source from 63.14 mg/L (San Antonio Water Company) to 248 mg/L (City of Chino, city wells). The softest water we serve is on the LA Westside: LADWP and Santa Monica both report about 103 mg/L (6.0 gpg), moderately hard. The widest swing is Vista Irrigation District, from 54 to 310 mg/L depending on the source. Nothing in this table is a health concern; hardness is about scale.
| Hardness level | Source | ||||
|---|---|---|---|---|---|
| San DiegoSan Diego County | City of San Diego Public Utilities Departmentaverages at the Alvarado, Miramar and Otay treatment plants (the report does not say which plant serves which area) | 13.8 to 14.2 | 237 to 243 | Very hard | City of San Diego 2025 Annual Drinking Water Quality Report2025 |
| La JollaSan Diego County | City of San Diego Public Utilities Departmentaverages at the Alvarado, Miramar and Otay treatment plants (the report does not say which plant serves which area) | 13.8 to 14.2 | 237 to 243 | Very hard | City of San Diego 2025 Annual Drinking Water Quality Report2025 |
| Rancho BernardoSan Diego County | City of San Diego Public Utilities Departmentaverages at the Alvarado, Miramar and Otay treatment plants (the report does not say which plant serves which area) | 13.8 to 14.2 | 237 to 243 | Very hard | City of San Diego 2025 Annual Drinking Water Quality Report2025 |
| La MesaSan Diego County | Helix Water DistrictHelix treatment plant average; the district describes nearly all of its water as treated there | 12.0 (range 9.1 to 14.6) | 206 (range 155 to 250) | Very hard | Helix Water District 2025 water quality report2025 |
| El CajonSan Diego County | Helix Water DistrictHelix treatment plant average; the district describes nearly all of its water as treated there | 12.0 (range 9.1 to 14.6) | 206 (range 155 to 250) | Very hard | Helix Water District 2025 water quality report2025 |
| Spring ValleySan Diego County | Helix Water DistrictHelix treatment plant average; the district describes nearly all of its water as treated there | 12.0 (range 9.1 to 14.6) | 206 (range 155 to 250) | Very hard | Helix Water District 2025 water quality report2025 |
| Spring ValleySan Diego County | Otay Water Districtdistribution system average; Otay serves eastern Chula Vista, Bonita, Jamul, Spring Valley and Rancho San Diego, and the report does not map its sources to areas | 9.4 (range 8.2 to 14.6) | 161 (range 140 to 250)* | Hard | Otay Water District 2025 water quality report2025 |
| SanteeSan Diego County | Padre Dam Municipal Water Districtrange by source, from 60 to 230 mg/L; the report gives no single average | 3.5 to 13.5* | 60 to 230 | Soft to very hard | Padre Dam Municipal Water District 2025 water quality report2025 |
| LakesideSan Diego County | Lakeside Water District, district wellsthe district's own wells; its main supply is Helix-treated water (206 mg/L). Parts of Lakeside are on Helix or Padre Dam, and many rural homes are on private wells | 27.6* | 472 | Very hard | Lakeside Water District Consumer Confidence Report, calendar year 20252025 |
| CoronadoSan Diego County | California American Water, Coronado systemrange for the year; no average published | 11.8 to 15.8* | 201 to 271 | Very hard | California American Water, Coronado system, 2025 water quality report2025 |
| Imperial BeachSan Diego County | California American Water, Coronado systemrange for the year; no average published | 11.8 to 15.8* | 201 to 271 | Very hard | California American Water, Coronado system, 2025 water quality report2025 |
| National CitySan Diego County | Sweetwater Authoritytreated drinking water; Sweetwater serves National City, Bonita and western and central Chula Vista | 11.3 (range 4.4 to 19.9)* | 193 (range 76 to 340) | Very hard | Sweetwater Authority 2025 water quality report2025 |
| Chula VistaSan Diego County | Sweetwater Authoritytreated drinking water; Sweetwater serves National City, Bonita and western and central Chula Vista | 11.3 (range 4.4 to 19.9)* | 193 (range 76 to 340) | Very hard | Sweetwater Authority 2025 water quality report2025 |
| Chula VistaSan Diego County | Otay Water Districtdistribution system average; Otay serves eastern Chula Vista, Bonita, Jamul, Spring Valley and Rancho San Diego, and the report does not map its sources to areas | 9.4 (range 8.2 to 14.6) | 161 (range 140 to 250)* | Hard | Otay Water District 2025 water quality report2025 |
| BonitaSan Diego County | Sweetwater Authoritytreated drinking water; Sweetwater serves National City, Bonita and western and central Chula Vista | 11.3 (range 4.4 to 19.9)* | 193 (range 76 to 340) | Very hard | Sweetwater Authority 2025 water quality report2025 |
| BonitaSan Diego County | Otay Water Districtdistribution system average; Otay serves eastern Chula Vista, Bonita, Jamul, Spring Valley and Rancho San Diego, and the report does not map its sources to areas | 9.4 (range 8.2 to 14.6) | 161 (range 140 to 250)* | Hard | Otay Water District 2025 water quality report2025 |
| CarlsbadSan Diego County | Carlsbad Municipal Water District, imported waterimported water; about 18% of supply is desalinated water at about 61 mg/L, and no blended figure is published | 13.5* | 230 | Very hard | Carlsbad Municipal Water District 2025 water quality report2025 |
| OceansideSan Diego County | City of Oceanside Water Utilities, Weese plantWeese treatment plant, about 72% of supply; desalinated water is about 61 mg/L | 13.2* | 226 | Very hard | City of Oceanside 2025 water quality report2025 |
| EncinitasSan Diego County | Olivenhain Municipal Water DistrictOlivenhain's own treatment plant; other parts of Encinitas are on San Dieguito Water District | 11.7* | 200 | Very hard | Olivenhain Municipal Water District 2025 water quality report2025 |
| EncinitasSan Diego County | San Dieguito Water Districtsystem figure; the 2025 report exists but could not be retrieved, so this is the 2024 report | 16.1 (range 14.6 to 17.5)* | 275 (range 250 to 300) | Very hard | San Dieguito Water District 2024 water quality report2024 |
| EscondidoSan Diego County | City of Escondido Utilitiesfinished water; parts of the area are on Rincon del Diablo Municipal Water District | 12.6* | 215 | Very hard | City of Escondido 2025 water quality report2025 |
| EscondidoSan Diego County | Rincon del Diablo Municipal Water District, ID-1Improvement District 1, mostly Lake Skinner water; check the district map for your address | 13.5 | 230 | Very hard | Rincon del Diablo MWD 2025 water quality report, ID-12025 |
| EscondidoSan Diego County | Rincon del Diablo Municipal Water District, ID-AImprovement District A, water from the Escondido treatment plant | 12.6 | 215 | Very hard | Rincon del Diablo MWD 2025 water quality report, ID-A2025 |
| San MarcosSan Diego County | Vallecitos Water District, imported waterthe three treatment plants behind its imported water; desalinated water is 68 mg/L. The district publishes mg/L only | 14.2 to 14.9* | 242 to 255 | Very hard | Vallecitos Water District 2024 water quality report2024 |
| PowaySan Diego County | City of Powayimported source water, 99.5% of supply | 12.7* | 218 | Very hard | City of Poway 2025 water quality report2025 |
| VistaSan Diego County | Vista Irrigation Districtrange over the year by source | 3.2 to 18.1 | 54 to 310 | Soft to very hard | Vista Irrigation District 2025 water quality report2025 |
| FallbrookSan Diego County | Fallbrook Public Utility Districtdistrict average; many rural properties are on private wells | 13.7* | 235 | Very hard | Fallbrook Public Utility District 2025 water quality report2025 |
| TemeculaTemecula Valley | Rancho California Water District, imported waterimported water; taps get a blend with district wells that shifts through the year | 13.5 (range 13.3 to 13.6)* | 230 (range 228 to 232) | Very hard | Rancho California Water District 2025 water quality report2025 (samples 2023 to 2025) |
| TemeculaTemecula Valley | Rancho California Water District, district wellslocal groundwater; taps get a blend with imported water | 8.8 (range 0.3 to 19.9)* | 151 (range 5 to 340) | Hard | Rancho California Water District 2025 water quality report2025 (samples 2023 to 2025) |
| TemeculaTemecula Valley | Eastern Municipal Water District, Skinner service areaimported water treated at the Skinner Filtration Plant; the report lists French Valley, Menifee, Murrieta, Rancho Glen Oaks, Temecula and Winchester in this service area | 13.4 (range 13.3 to 13.6) | 229 (range 227 to 233)* | Very hard | Eastern Municipal Water District 2025 water quality report2025 |
| MurrietaTemecula Valley | Rancho California Water District, imported waterimported water; taps get a blend with district wells that shifts through the year | 13.5 (range 13.3 to 13.6)* | 230 (range 228 to 232) | Very hard | Rancho California Water District 2025 water quality report2025 (samples 2023 to 2025) |
| MurrietaTemecula Valley | Rancho California Water District, district wellslocal groundwater; taps get a blend with imported water | 8.8 (range 0.3 to 19.9)* | 151 (range 5 to 340) | Hard | Rancho California Water District 2025 water quality report2025 (samples 2023 to 2025) |
| MurrietaTemecula Valley | Western Municipal Water District, Murrieta service area, groundwaterlocal groundwater | 9.7 (range 2.9 to 17.5)* | 166 (range 50 to 300) | Hard | Western Municipal Water District 2025 water quality report (Murrieta service area)2025 |
| MurrietaTemecula Valley | Western Municipal Water District, Murrieta service area, surface watersurface water from the Skinner, Hemet and Perris plants | 8.8 (range 3.9 to 16.4)* | 150 (range 67 to 281) | Hard | Western Municipal Water District 2025 water quality report (Murrieta service area)2025 |
| MurrietaTemecula Valley | Eastern Municipal Water District, Skinner service areaimported water treated at the Skinner Filtration Plant; the report lists French Valley, Menifee, Murrieta, Rancho Glen Oaks, Temecula and Winchester in this service area | 13.4 (range 13.3 to 13.6) | 229 (range 227 to 233)* | Very hard | Eastern Municipal Water District 2025 water quality report2025 |
| MenifeeTemecula Valley | Eastern Municipal Water District, Mills Filtration Plantthe plant that typically serves Menifee; occasionally Skinner water (13.4 gpg) | 5.1 (range 4.8 to 5.5) | 87 (range 82 to 94)* | Moderately hard | Eastern Municipal Water District 2025 water quality report2025 |
| WinchesterTemecula Valley | Eastern Municipal Water District, Hemet Filtration Plantthe plant that typically serves Winchester; occasionally Skinner water (13.4 gpg) | 5.4 (range 3.9 to 7.2) | 92 (range 67 to 123)* | Moderately hard | Eastern Municipal Water District 2025 water quality report2025 |
| Lake ElsinoreTemecula Valley | Elsinore Valley Municipal Water Districtdistribution system average; its sources range from about 93 to 338 mg/L | 9.5 (range 4.4 to 14.0)* | 162 (range 76 to 240) | Hard | Elsinore Valley Municipal Water District 2025 water quality report2025 |
| WildomarTemecula Valley | Elsinore Valley Municipal Water Districtdistribution system average; its sources range from about 93 to 338 mg/L | 9.5 (range 4.4 to 14.0)* | 162 (range 76 to 240) | Hard | Elsinore Valley Municipal Water District 2025 water quality report2025 |
| Canyon LakeTemecula Valley | Elsinore Valley Municipal Water Districtdistribution system average; its sources range from about 93 to 338 mg/L | 9.5 (range 4.4 to 14.0)* | 162 (range 76 to 240) | Hard | Elsinore Valley Municipal Water District 2025 water quality report2025 |
| WildomarTemecula Valley | Eastern Municipal Water District, Mills service areaaverages by source, from the Mills Filtration Plant (5.1 gpg) to Perris Valley wells (19 gpg); the report does not say which source serves Wildomar | 5.1 to 19.0 | 87 to 325* | Moderately hard to very hard | Eastern Municipal Water District 2025 water quality report2025 |
| CoronaInland Empire and Riverside County | City of Corona Utilities Departmenttreated system average; sources range from State Project water (88) to groundwater (452) | 8.5 | 146 (range 7.2 to 290) | Hard | City of Corona 2025 water quality report2025 |
| EastvaleInland Empire and Riverside County | Jurupa Community Services Districtsystem average | 9.5 (range 1.5 to 12.9)* | 162 (range 25 to 220) | Hard | Jurupa Community Services District 2025 water quality report2025 |
| OntarioInland Empire and Riverside County | Ontario Municipal Utilities Company, local groundwaterlocal groundwater | 7.3 (range 4.8 to 8.8)* | 124 (range 82 to 150) | Hard | Ontario Municipal Utilities Company 2025 water quality report2025 |
| OntarioInland Empire and Riverside County | Ontario Municipal Utilities Company, imported waterimported water treated by the Water Facilities Authority | 5.3 (range 5.0 to 5.8)* | 91 (range 85 to 99) | Moderately hard | Ontario Municipal Utilities Company 2025 water quality report2025 |
| OntarioInland Empire and Riverside County | Ontario Municipal Utilities Company, purchased groundwatergroundwater bought from JCSD (177) and the Chino Desalter Authority (137 and 140), by zone | 8.0 to 10.4* | 137 to 177 | Hard | Ontario Municipal Utilities Company 2025 water quality report2025 |
| ChinoInland Empire and Riverside County | City of Chino, city wellscity wells | 14.5 (range 13.5 to 15.2)* | 248 (range 230 to 260) | Very hard | City of Chino 2025 water quality report2025 |
| ChinoInland Empire and Riverside County | City of Chino, Chino Desalter Authoritydesalted groundwater (sampled 2024) | 8.7 (range 5.8 to 11.1)* | 148 (range 100 to 190) | Hard | City of Chino 2025 water quality report2025 |
| ChinoInland Empire and Riverside County | City of Chino, Water Facilities Authorityimported water | 5.3 (range 4.9 to 5.8)* | 90.8 (range 84.5 to 99.1) | Moderately hard | City of Chino 2025 water quality report2025 |
| Chino HillsInland Empire and Riverside County | City of Chino Hills, Chino 1 Desalterdesalted groundwater | 8.7 (range 5.8 to 11.1)* | 148 (range 100 to 190) | Hard | City of Chino Hills 2025 water quality report2025 |
| Chino HillsInland Empire and Riverside County | City of Chino Hills, Monte Vista Water Districtwater bought from Monte Vista | 5.9 (range 5.3 to 12.3)* | 101 (range 91 to 210) | Moderately hard | City of Chino Hills 2025 water quality report2025 |
| Chino HillsInland Empire and Riverside County | City of Chino Hills, city wellsno figure printed for the city's wells | Not published | Not published | Not published | City of Chino Hills 2025 water quality report2025 |
| UplandInland Empire and Riverside County | City of Uplandsystem average; the low end of the range is printed as not detected, up to 340 | 7.0* | 120 | Moderately hard | City of Upland 2025 water quality report2025 |
| UplandInland Empire and Riverside County | San Antonio Water Companysystem average (sampled 2024, printed in the 2025 report) | 3.7 (range 0.0 to 7.3)* | 63.14 (range 0 to 124.99) | Moderately hard | San Antonio Water Company 2025 water quality report2025 |
| MontclairInland Empire and Riverside County | Monte Vista Water Districtsystem average | 7.9 (range 5.3 to 19.9)* | 135 (range 90.8 to 340) | Hard | Monte Vista Water District 2025 water quality report2025 |
| FontanaInland Empire and Riverside County | Fontana Water Company, groundwatergroundwater | 8.9 (range 5.7 to 10.9)* | 151.35 (range 97.8 to 187) | Hard | Fontana Water Company 2025 water quality report2025 |
| FontanaInland Empire and Riverside County | Fontana Water Company, surface watertreated surface water | 7.8 (range 6.2 to 9.5)* | 134 (range 106 to 162) | Hard | Fontana Water Company 2025 water quality report2025 |
| Rancho CucamongaInland Empire and Riverside County | Cucamonga Valley Water Districtsystem average | 7.3 (range 6.4 to 8.3)* | 125.5 (range 109 to 142) | Hard | Cucamonga Valley Water District 2025 water quality report2025 |
| RedlandsInland Empire and Riverside County | City of Redlands, groundwatergroundwater | 8.7 (range 5.8 to 11.7)* | 148 (range 100 to 200) | Hard | City of Redlands 2025 water quality report2025 |
| RedlandsInland Empire and Riverside County | City of Redlands, treated surface watertreated surface water | 6.8 (range 5.5 to 8.2)* | 117 (range 94 to 140) | Moderately hard | City of Redlands 2025 water quality report2025 |
| WestchesterLA Westside | Los Angeles Department of Water and Power (LADWP)Los Angeles Aqueduct Filtration Plant | 6.0 (range 5.6 to 6.8) | 103 (range 96 to 117) | Moderately hard | LADWP Drinking Water Quality Report 20252025 |
| VeniceLA Westside | Los Angeles Department of Water and Power (LADWP)Los Angeles Aqueduct Filtration Plant | 6.0 (range 5.6 to 6.8) | 103 (range 96 to 117) | Moderately hard | LADWP Drinking Water Quality Report 20252025 |
| Santa MonicaLA Westside | City of Santa Monica Water Resourceslocal groundwater after treatment at the Arcadia plant | 6.0 (range 4.7 to 7.5) | 103 (range 80 to 129) | Moderately hard | City of Santa Monica Annual Drinking Water Quality Report (2025 data)2025 |
| Culver CityLA Westside | Golden State Water Company, Culver City SystemCulver City System | 12.0 (range 8.0 to 16.0) | 203 (range 137 to 280) | Very hard | Golden State Water Culver City System Consumer Confidence Report for 20252025 |
| InglewoodLA Westside | City of Inglewood, local well groundwaterlocal well groundwater | 16.0 (range 10.6 to 21.4) | 274 (range 181 to 366) | Very hard | City of Inglewood 2025 Annual Water Quality Report2025 |
| InglewoodLA Westside | City of Inglewood, imported MWD surface waterimported surface water | 11.9 (range 8.0 to 16.4) | 203 (range 137 to 280) | Very hard | City of Inglewood 2025 Annual Water Quality Report2025 |
| InglewoodLA Westside | Golden State Water Company, Southwest SystemSouthwest System | 11.0 (range 8.0 to 16.0) | 190 (range 137 to 280) | Very hard | City of Inglewood 2025 Annual Water Quality Report2025 |
| Marina del ReyLA Westside | Los Angeles County Waterworks District No. 29, Marina del Rey Water Systemno hardness figure published for this system | Not published | Not published | Not published | LA County Waterworks District No. 29 (Malibu and Marina del Rey) 2025 Consumer Confidence Report2025 |
Cite this data
You're welcome to use this data with a link to this page: https://www.pipedreamplumbersca.com/water-hardness-by-city/
Why does hardness change from year to year?
Most of the water in San Diego County is imported, and it comes from two places: the Colorado River and the State Water Project from Northern California. Colorado River water carries more dissolved minerals. The San Diego County Water Authority notes that the Metropolitan Water District's blend of the two shifts with how wet the year is and how Metropolitan runs its system. Local districts then add their own reservoir water, wells or desalinated water. A year heavier in Colorado River water tests harder at your tap.
One district's report shows the gap side by side. Eastern Municipal's water from the Mills plant, which treats State Water Project water and typically serves Menifee, averaged 5.1 grains per gallon. Its water from the Skinner plant, which treats a blend that includes Colorado River water, averaged 13.4. That's why every row in the table carries its report year.
What does hard water do to plumbing?
Hard water carries dissolved calcium and magnesium. When it is heated or evaporates, those minerals come out as scale. In a tank water heater the scale settles on the bottom, the burner heats through it, and you hear popping or rumbling. In a tankless unit it coats the heat exchanger, which is why tankless heaters on hard water need regular descaling.
The same minerals crust faucet aerators and shower heads, wear out fill valves and cartridges early, spot glass and leave film in the dishwasher. Hardness is an aesthetic and scale issue, not a health concern: there is no health-based limit for it, and every system in this table reports to the state on the standards that do apply.
How is a salt-free conditioner different from a softener?
A salt-based water softener is the only home system that removes hardness. It trades calcium and magnesium for sodium in a resin tank, regenerates with salt brine, and needs salt, a drain and power. After a softener, the water tests soft. See water softener installation.
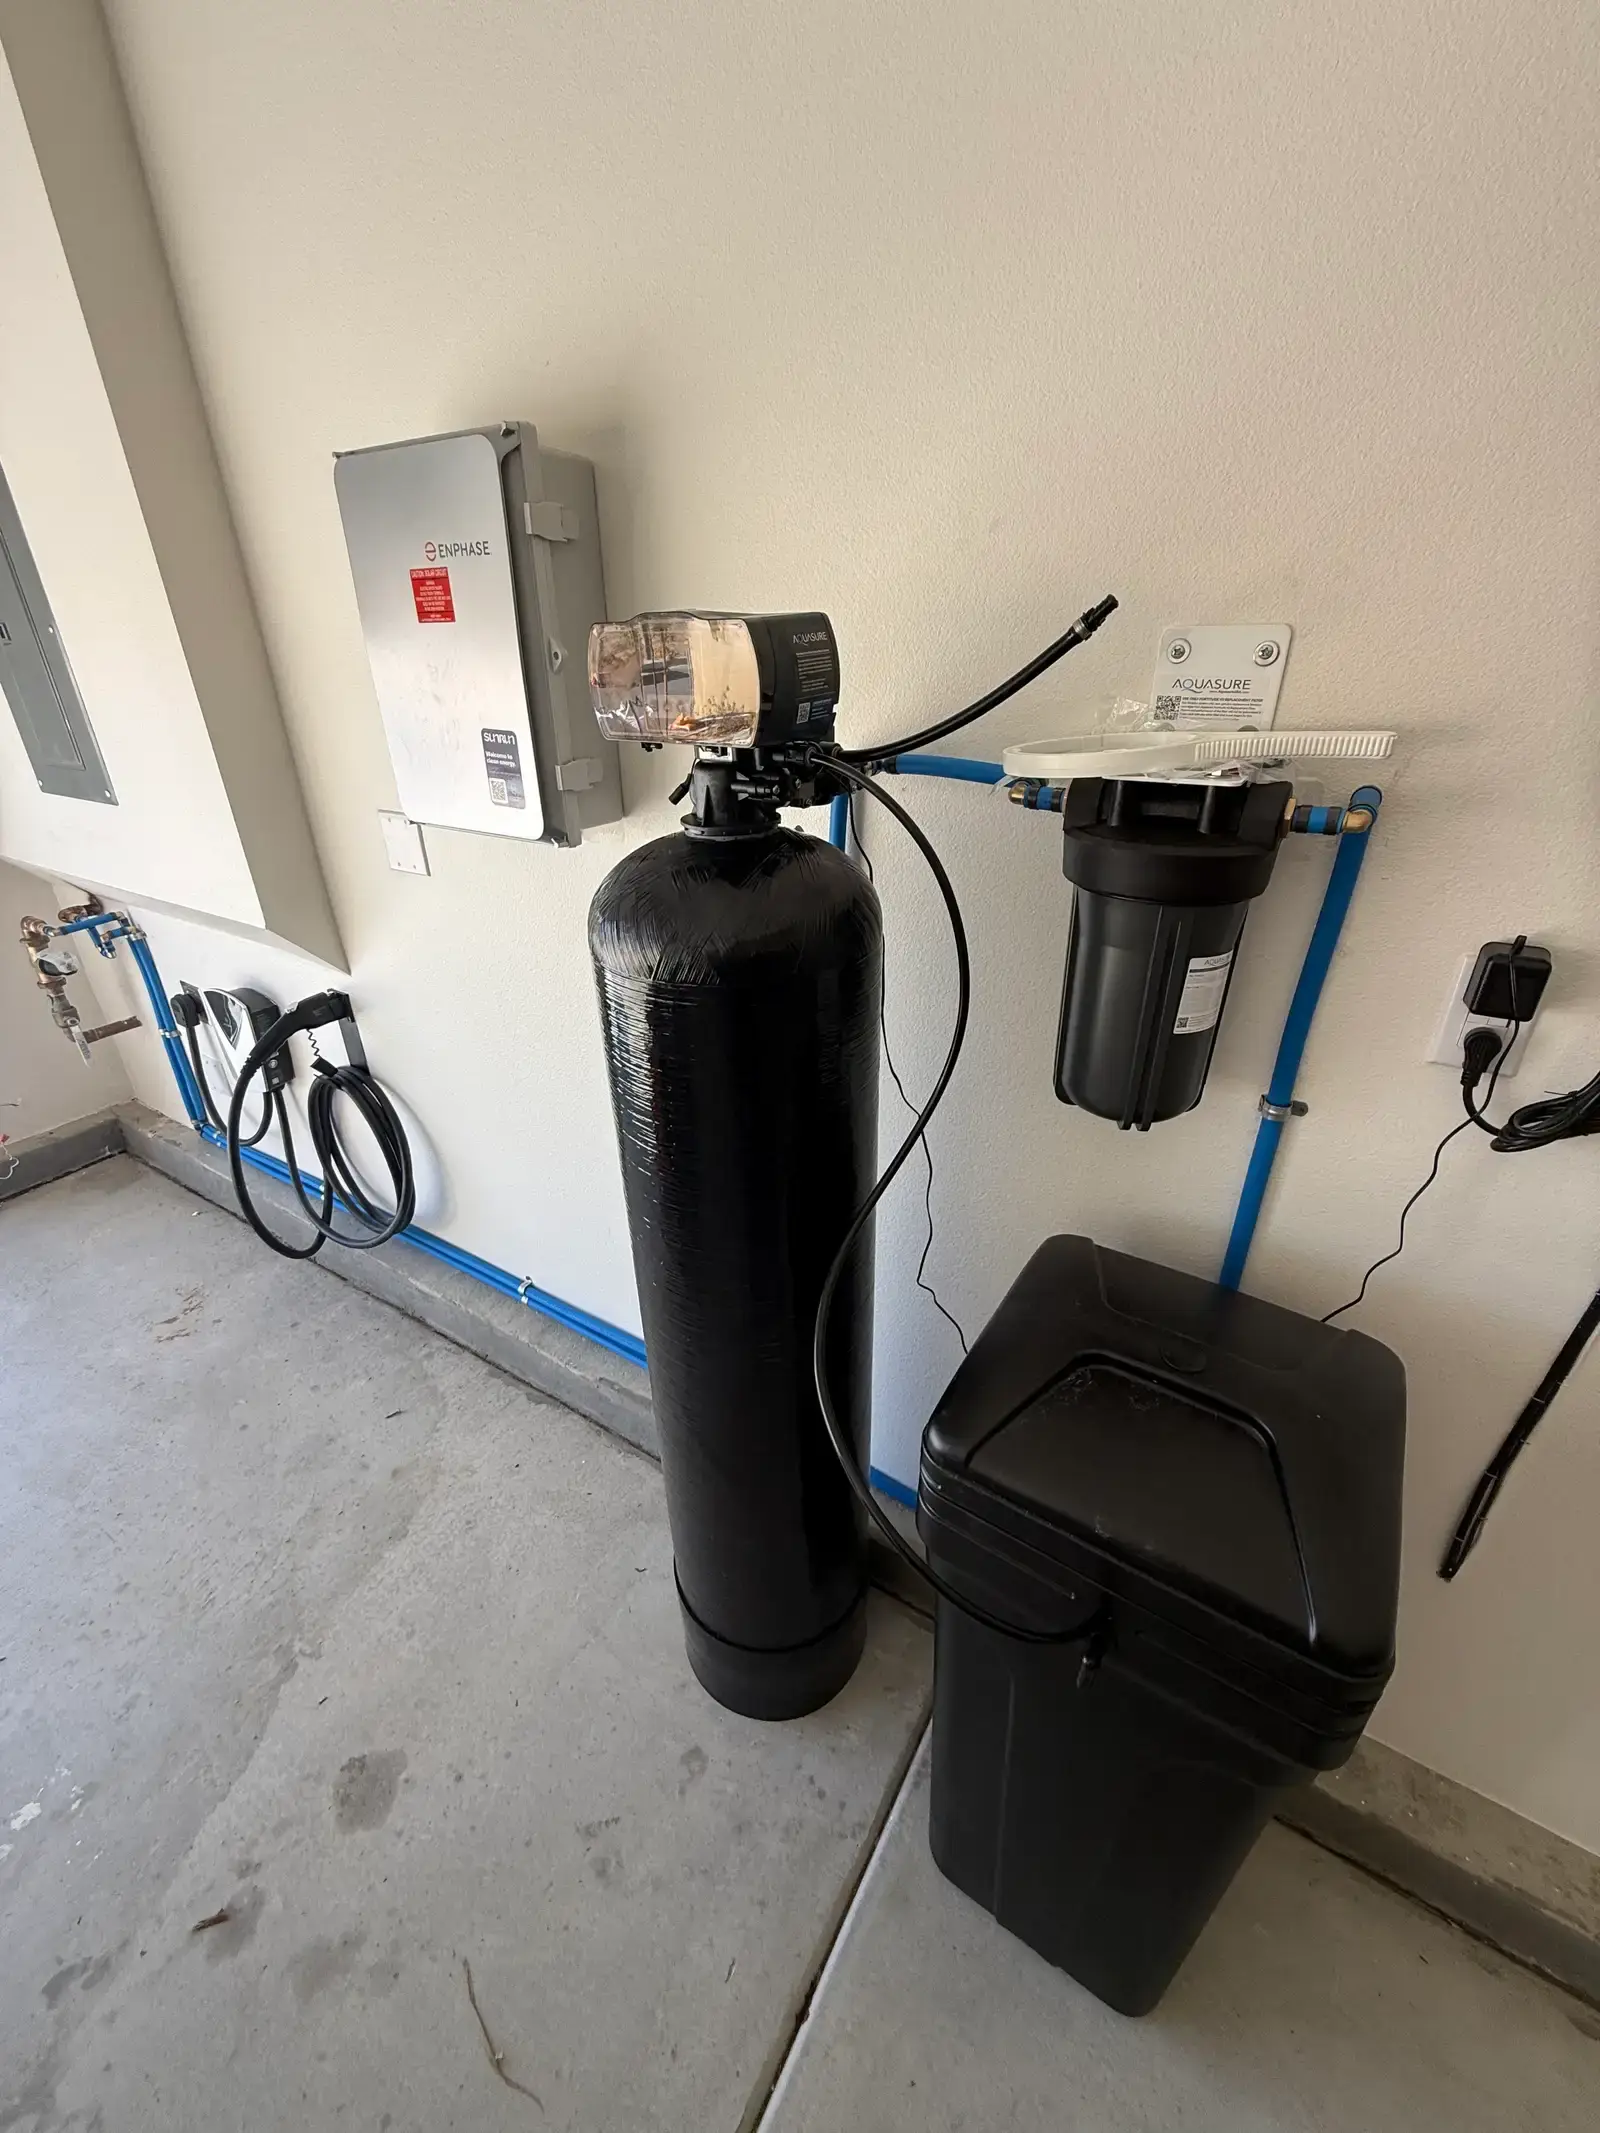
A salt-free conditioner is a different product, and it is not a softener. It does not remove hardness minerals, so the water still tests hard and glass can still spot. What it is designed to do is reduce scale forming inside pipes and the water heater, with no salt, drain or power. It is the compliant option in the Inland Empire cities where new salt softeners are prohibited. See salt-free water conditioning and our water system guide.
How do you read your own water quality report?
- Start with your water bill. The system named there is the one whose report applies to you, and it isn't always the one your city's name suggests.
- Open the report. The Source link in each row goes straight to it. The State Water Resources Control Board also keeps every California system's filed reports on its electronic annual report site, which is where most of our links point.
- Find the hardness line. It usually sits in the table of secondary or unregulated constituents, sometimes under a heading like “Sodium and Hardness.” Look for total hardness as calcium carbonate, printed in mg/L or ppm, which mean the same thing for drinking water.
- Check what the number describes, and the year. One system average, one figure per treatment plant, and a range by source each tell you something different. If your system lists several plants or sources, your tap gets a blend the report doesn't pin down.
- Convert it if you're comparing equipment. Softeners are rated in grains per gallon. Helix's 206 mg/L, for example, is the 12.0 grains per gallon printed in the same report.
How was this data collected?
Every figure is total hardness as calcium carbonate from the water system's most recent Consumer Confidence Report or annual water quality report, linked in the Source column. Where a city is served by more than one system, or one system reports its sources separately, each gets its own row. We print what the report prints: an average where it gives one, a range where that is all it gives. We do not average or estimate.
Grains per gallon are the report's own figure where it prints them. Otherwise they are mg/L divided by 17.1, rounded to one decimal, and marked with an asterisk. A few reports, including Eastern Municipal's and Otay's, print only grains per gallon; for those the mg/L is the conversion, also marked. Levels use the U.S. Geological Survey scale: 0 to 60 mg/L soft, 61 to 120 moderately hard, 121 to 180 hard, and above 180 very hard. A range that crosses two levels shows both.
No hardness figure was published for: City of Chino Hills, city wells (Chino Hills); Los Angeles County Waterworks District No. 29, Marina del Rey Water System (Marina del Rey). Those rows say “Not published” rather than show a guess.
Your own tap can differ from a district figure, because of the blend that week and your home's plumbing. If you are deciding on treatment, we test at your hose bib first.
What else do people ask about hard water?
Is hard water safe to drink?
Hardness is calcium and magnesium, and there is no health-based limit for it in federal or California drinking water rules. It is a scale and appliance issue: it builds up in water heaters, spots glass and fixtures, and changes how soap and shampoo feel. Your water system's report covers the standards that do apply to safety.
Why do the numbers for my city show a range?
Many systems blend sources, such as imported water and local wells or desalinated water, and the mix shifts during the year. Some reports print one average, some print each source, and some print only a range. We show what the report prints rather than averaging it ourselves.
How do I know which water district serves my address?
Your water bill names it. Several cities are split between districts, including Temecula, Murrieta, Encinitas, Chula Vista and Inglewood, so neighbors a few streets apart can get different water.
What hardness level is worth treating?
On the U.S. Geological Survey scale, anything above 180 mg/L, about 10.5 grains per gallon, is very hard. Most of the cities in this table are in that range. Whether to treat it depends on what bothers you: scale in the water heater, spots on glass, or how the water feels. We test at your tap before recommending anything, then size a softener from your household's water use and that reading, or a salt-free conditioner from your bathrooms and peak flow.
Where is the softest water in San Diego County?
The lowest figures in the county are for desalinated seawater: about 61 mg/L in the Carlsbad and Oceanside reports and 68 mg/L in Vallecitos's report for San Marcos. Vista Irrigation District's range also dips to 54 mg/L for some sources. All of these are blended with very hard imported water, and none of those reports prints a figure for the blend, so what reaches your tap depends on the mix that month. We test at the tap rather than guess.
Why do the hardness numbers I find online disagree?
Many of them don't come from a water system. Equipment sellers often quote one county-wide number, or a high one, with no report or year behind it. Hardness moves enough between years and between treatment plants that an undated number can be off by several grains. If someone quotes you a hardness figure while selling you a system, ask which report it came from and which year. Every figure on this page links to its report, and a test at your own tap beats any of them.
Does this table apply if my home is on a private well?
No. A water system's report only covers the water that system delivers. Private wells are common on rural properties around Lakeside and Fallbrook, and a well's hardness can be very different from anything in this table, so it needs its own test. San Diego County's Department of Environmental Health and Quality has guidance on testing private wells.
Does softening or salt-free conditioning take out chlorine or chloramine?
No. Both deal with hardness and scale, not disinfectant. Water systems keep chlorine or chloramine in the water on purpose, at levels the state regulates, so it stays disinfected all the way to your tap. If the taste or smell bothers you, a whole-house carbon filter is what treats it, and chloramine needs a carbon rated for it. A carbon filter can go in alongside either system.
Can I use this data on my own site?
Yes. You are welcome to use this data with a link to this page. The CSV download has the same rows and sources.